AI Operations Monitoring
Observability and an AI improvement cycle in development
 Written byGeorge Khananaev
Inside the project
1 / 2 · Service health dashboard
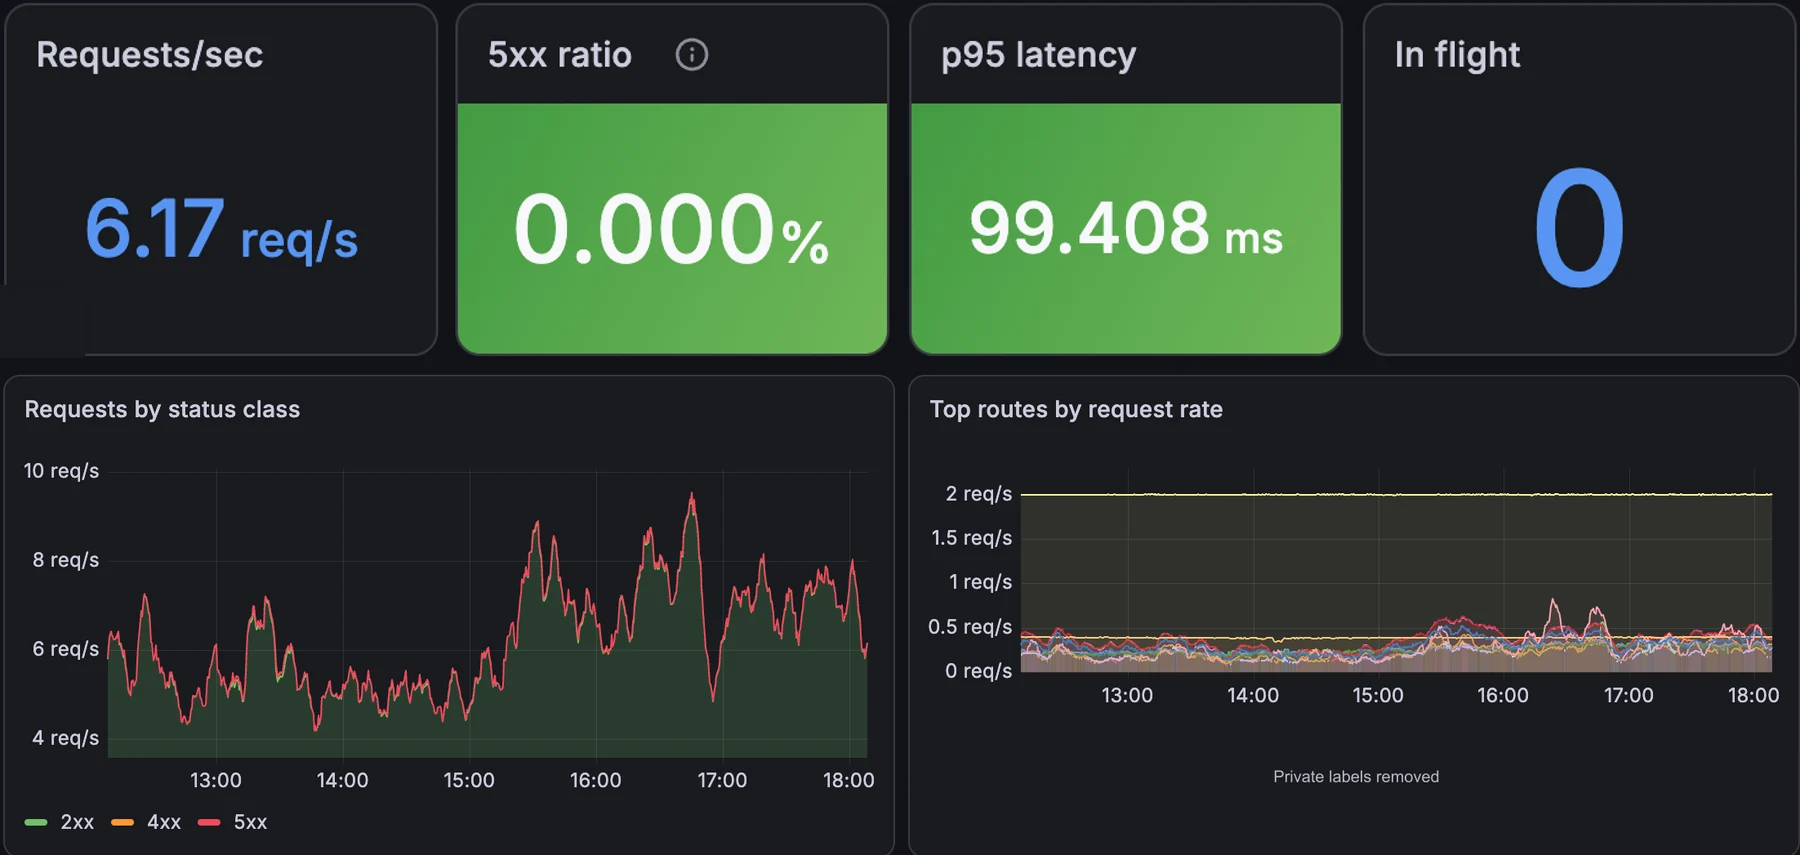
Selected Grafana dashboard panels for request rates, errors and latency. Private labels removed.
Open imageThe problem
Teams need usable operational signals before they can respond effectively to incidents or decide what to improve. Dashboards and alerts help make that work visible; an AI-assisted improvement workflow can build on that foundation.
What is implemented
The project includes a monitoring foundation for operational observability. The reviewed technology set includes Grafana, Prometheus, Loki, Grafana Alloy, Alertmanager and OpenTelemetry.
The screenshots show selected Grafana panels for service health, response times, request outcomes and traffic trends, with private labels removed.
AI improvement workflow: in development
The intended AI cycle connects operational evidence with issue triage, a proposed software change and verification. The end-to-end automatic incident-to-pull-request loop is in development; this page does not describe it as fully deployed or self-repairing in production.
My focus is the complete operational cycle: collect useful signals, turn them into actionable engineering work, and evaluate the resulting change. The AI workflows page explains that broader initiative and its illustrative stages.
Technologies
Grafana, Prometheus, Loki, OpenTelemetry.
Explore more business applications and tools or my approach to AI workflows.