Live Deck: Real-Time Call-Center Analytics
Live and historical insights, configurable widgets, and TV-ready dashboards
 Written byGeorge Khananaev
Inside the project
1 / 2 · Company sign-in
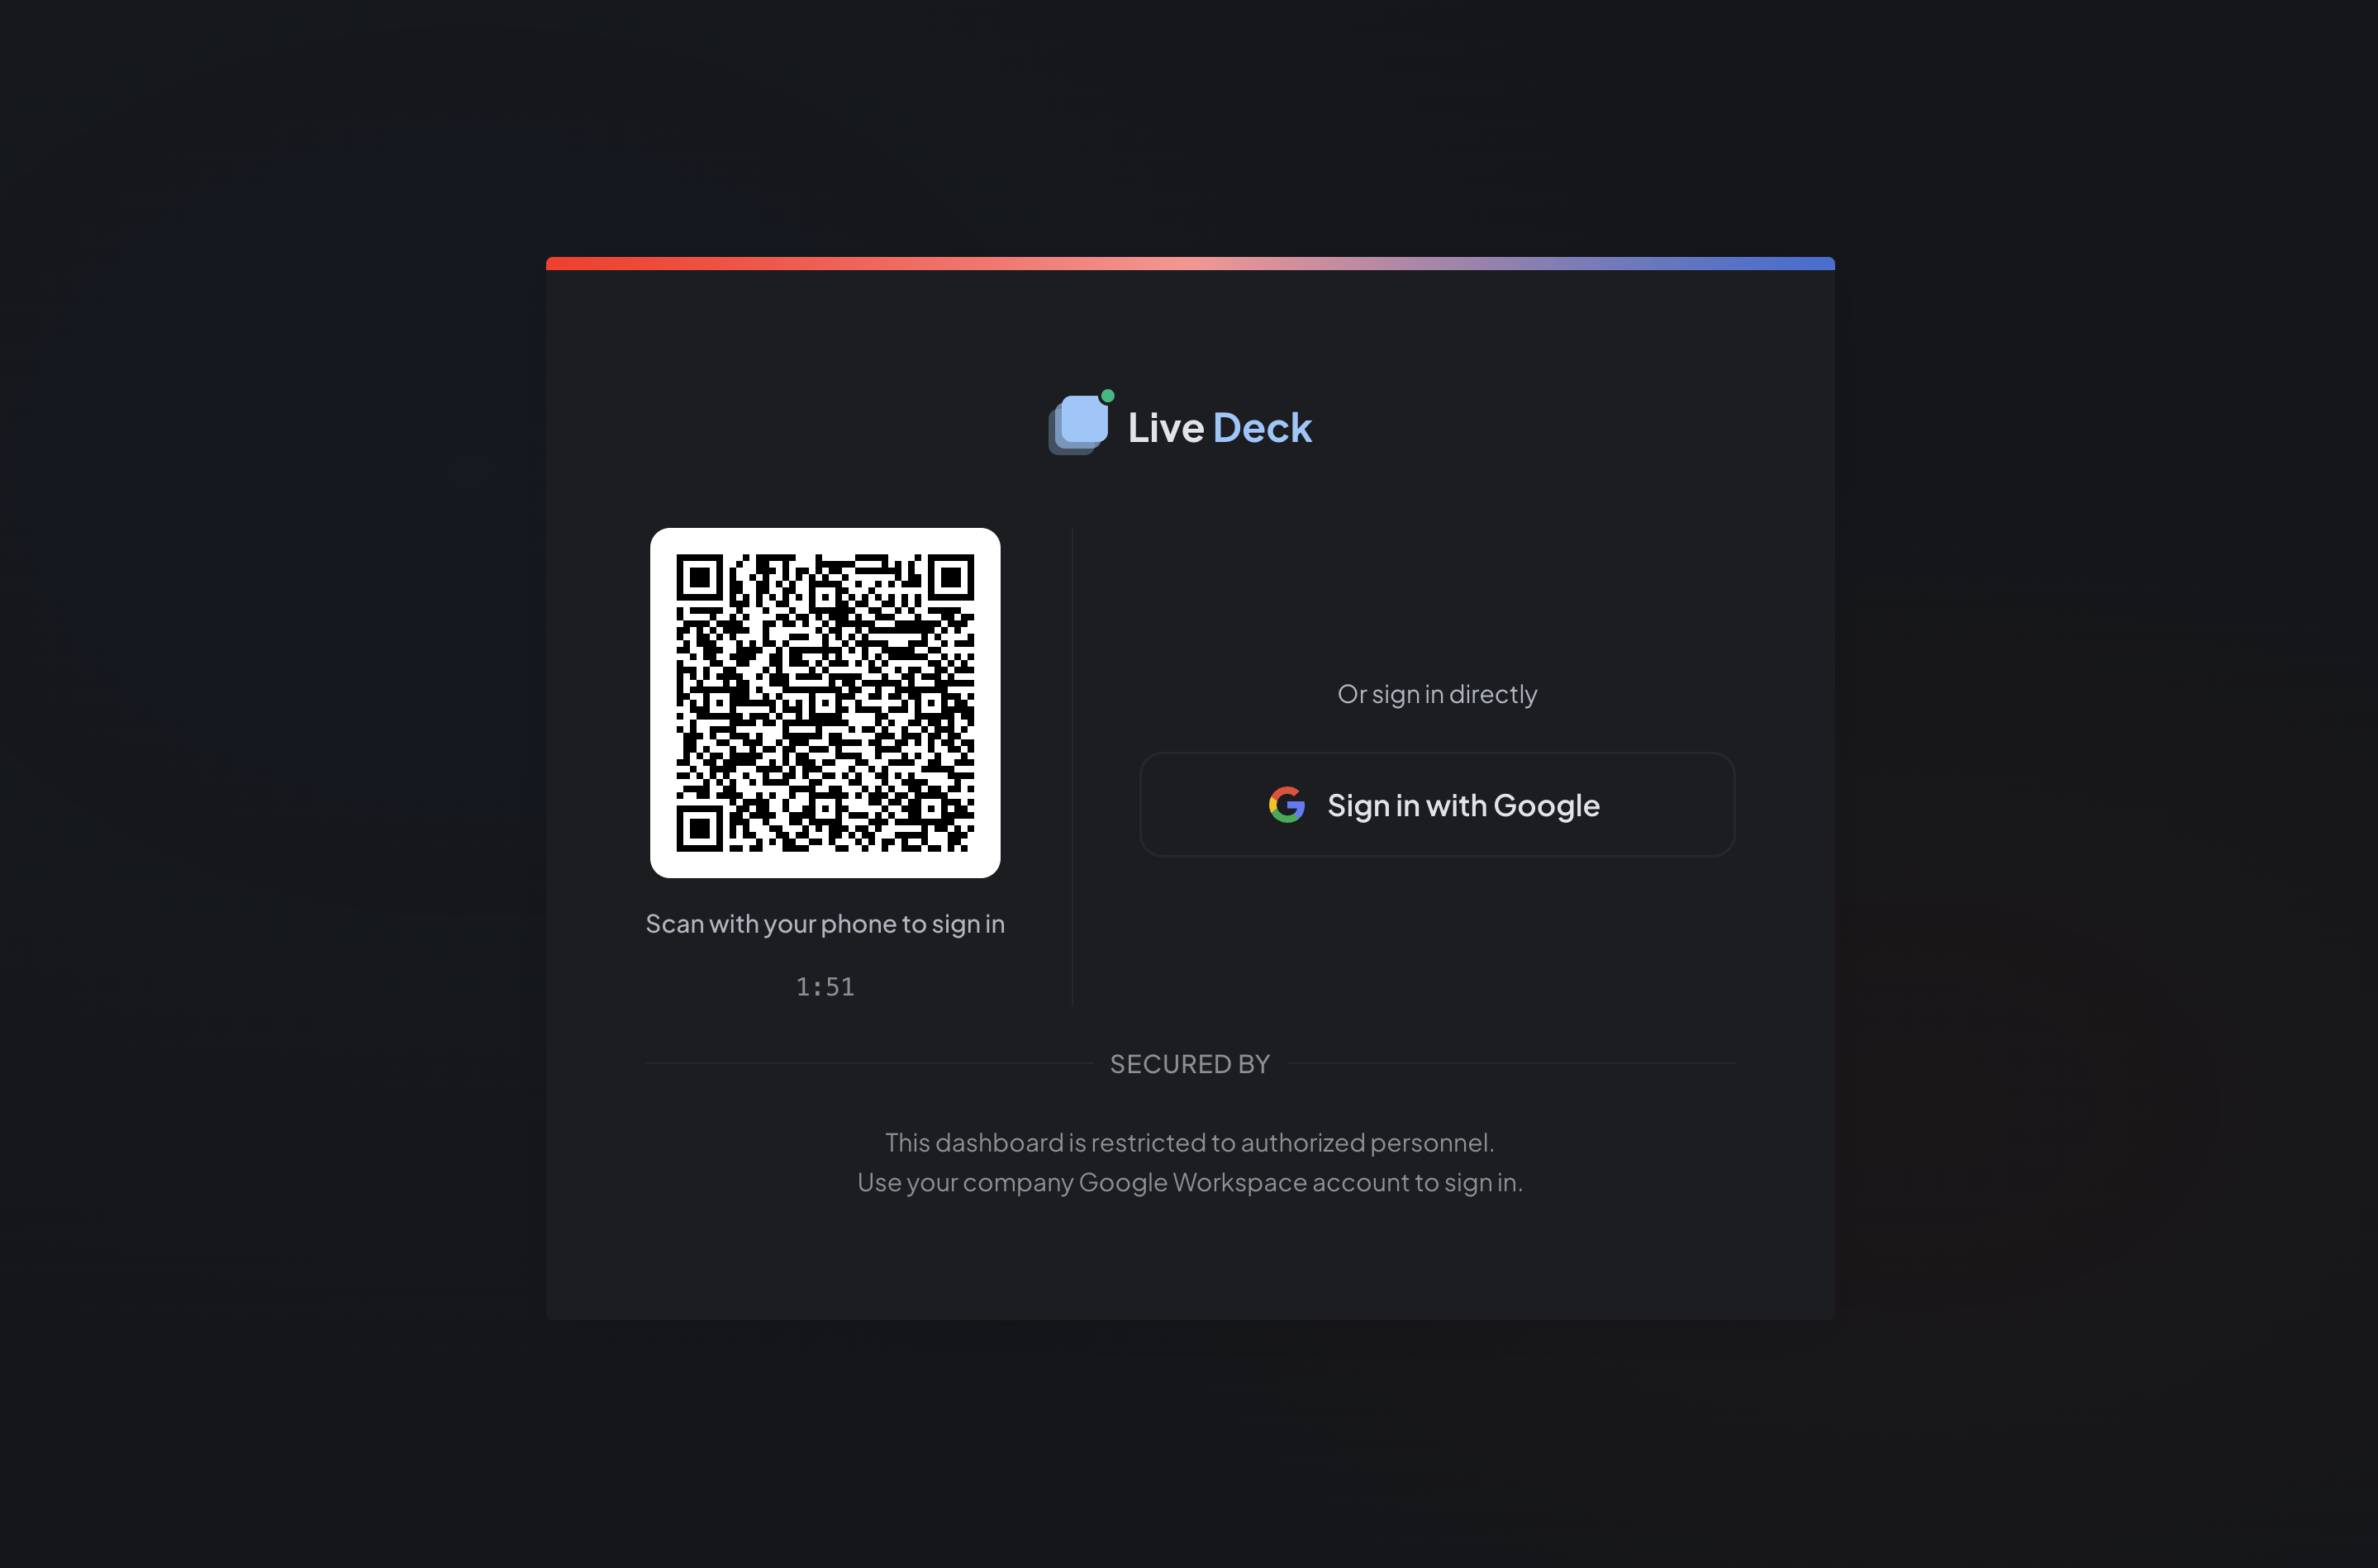
Sign-in by phone using a QR code, or directly with a company Google Workspace account. Supplied product screenshot.
Open imageCall-center analytics on the team screen
Live Deck is a call-center analytics dashboard built for Moon Holidays. It brings live activity and historical performance into a shared workspace, helping customer service teams follow what is happening now and review how the day has developed.
I worked on the product's design, engineering, and delivery, connecting the analytics experience with the practical needs of workplace displays. The application combines configurable dashboards, persistent display profiles, and controls suited to TVs and kiosks.
Live activity and historical performance
Real-time WebSocket streaming keeps the dashboard connected to changing call-center activity. Historical views provide a complementary perspective, with date-based analysis and comparisons that help teams move between immediate awareness and longer-term performance.
The Customer Service dashboard brings together call and agent metrics, hourly activity, performance tables, missed-call reasons, recent calls, phone-line performance, and notifications. These views give teams several ways to understand workload and service activity within one dashboard.
A layout that fits the team
A draggable 32 × 18 grid lets users arrange dashboard widgets around the information they need most. Per-widget configuration provides control over individual panels, while multiple saved profiles support different display setups and working preferences.
This makes the dashboard adaptable to the environment: a shared team screen can prioritize a concise operational overview, while another profile can give more space to detailed performance information.
Designed for TVs and kiosks
Live Deck supports spatial navigation and automatic view rotation for shared displays. Its presentation controls and configurable layout help the dashboard work in environments where a mouse and keyboard are not always convenient.
Content-aware right-to-left rendering supports mixed-language information. Server-Sent Events distribute updates, with stalled-connection detection helping long-running displays recover when an update stream stops responding.
Company access and department navigation
The sign-in screen offers QR-code sign-in by phone and direct Google sign-in using a company Google Workspace account. The branded landing page provides a department selector and visible server status.
Customer Service is the implemented dashboard. Sales and Marketing remain clearly marked as coming soon. The supplied screenshots show the sign-in and department-selection experience; they do not show the analytics workspace itself.
Technologies
- Interface: React 19, TypeScript, Vite 7, React Server Components, and Material UI.
- Analytics and data: Recharts, TanStack Query, and SQLite-backed settings.
- Live updates: WebSocket streaming and Server-Sent Events.
- Access and validation: Firebase Authentication and Zod.
- Delivery and testing: Node.js, Docker, Vitest, and React Testing Library.